<?xml version="1.0" encoding="utf-8"?><feed xmlns="http://www.w3.org/2005/Atom" ><generator uri="https://jekyllrb.com/" version="3.10.0">Jekyll</generator><link href="https://mmarwah.github.io/feed.xml" rel="self" type="application/atom+xml" /><link href="https://mmarwah.github.io/" rel="alternate" type="text/html" /><updated>2026-05-03T11:22:45+00:00</updated><id>https://mmarwah.github.io/feed.xml</id><title type="html">Manas Marawaha</title><subtitle>Principal Embedded Engineer. Linux firmware, device drivers, and Linux debugging courses.</subtitle><author><name>Manas Marawaha</name><email>manas.marwah@gmail.com</email></author><entry><title type="html">Performance Analysis in Linux: Measuring and Understanding Optimization</title><link href="https://mmarwah.github.io/blog/performance-analysis-linux/" rel="alternate" type="text/html" title="Performance Analysis in Linux: Measuring and Understanding Optimization" /><published>2025-10-12T00:00:00+00:00</published><updated>2025-10-12T00:00:00+00:00</updated><id>https://mmarwah.github.io/blog/performance-analysis-linux</id><content type="html" xml:base="https://mmarwah.github.io/blog/performance-analysis-linux/"><![CDATA[<h2 id="the-importance-of-performance-analysis"><strong>The Importance of Performance Analysis</strong></h2>

<p>Performance analysis is a critical part of software development and system optimization. It helps developers understand where CPU time is spent, how efficiently cache memory is used, and how code changes influence performance. Without such insight, optimization becomes guesswork.</p>

<p>Linux provides a rich ecosystem of performance analysis tools. Among these, <strong>Cachegrind</strong>, <strong>Callgrind</strong>, and <strong>perf stat</strong> stand out as powerful utilities that enable developers to understand their program’s behaviour from both simulated and real-hardware perspectives.</p>

<p>Before diving into these tools, let’s briefly discuss <strong>CPU caching</strong>.</p>

<p>Modern CPUs use multi-level caches (L1, L2, L3) to bridge the speed gap between the processor and main memory. Efficient cache usage can dramatically improve performance, while cache misses lead to costly main-memory accesses.</p>

<p>Two core principles govern cache efficiency:</p>
<ul>
  <li><strong>Temporal Locality:</strong> If a program accesses a memory location, it is likely to access the same location again soon.</li>
  <li><strong>Spatial Locality:</strong> If a program accesses a memory location, it is likely to access nearby locations soon.</li>
</ul>

<p>Optimizing code to exploit these properties — for example, by accessing arrays sequentially, can make a dramatic difference. Profiling tools such as Cachegrind and perf stat allow us to observe and quantify these effects.</p>

<h2 id="matrix-multiplication-example">Matrix Multiplication Example</h2>

<p>To demonstrate these tools, we will analyze three versions of a matrix multiplication program that multiplies two 512×512 floating-point matrices. The example set are part of <a href="https://www.udemy.com/course/linux-debug-training-part-2/?referralCode=1FAF95060F47194A895F">Linux Debug Training</a> course.</p>

<p>Example link: <a href="https://github.com/SpecialistLinuxTraining/linux-debug-training/tree/main/Examples/matrix_multiplication">https://github.com/SpecialistLinuxTraining/linux-debug-training/tree/main/Examples/matrix_multiplication</a></p>

<ol>
  <li><a href="https://github.com/SpecialistLinuxTraining/linux-debug-training/blob/main/Examples/matrix_multiplication/matrix_traditional.c">matrix_traditional </a>— Implements the classic triple nested loop algorithm:</li>
</ol>

<div class="language-plaintext highlighter-rouge"><div class="highlight"><pre class="highlight"><code>for (i = 0; i &lt; SIZE; i++)
 for (j = 0; j &lt; SIZE; j++)
 for (k = 0; k &lt; SIZE; k++)
 C[i][j] += A[i][k] * B[k][j];
</code></pre></div></div>

<p>This version is simple but cache-inefficient, as it repeatedly accesses non-contiguous elements of matrix <strong>B</strong>.</p>

<ol>
  <li>
    <p><a href="https://github.com/SpecialistLinuxTraining/linux-debug-training/blob/main/Examples/matrix_multiplication/matrix_avx2_basic.c">matrix_avx2_basic</a> — Uses <strong>AVX2</strong> SIMD instructions to process eight floating-point values simultaneously. This reduces loop iterations and improves throughput by vectorizing operations.</p>
  </li>
  <li>
    <p><a href="https://github.com/SpecialistLinuxTraining/linux-debug-training/blob/main/Examples/matrix_multiplication/matrix_avx2_optimized.c">matrix_avx2_optimized</a> — Builds upon the AVX2 version with optimization techniques like <strong>blocking (tiling)</strong> and <strong>loop unrolling:</strong></p>
    <ul>
      <li><strong>Blocking</strong> enhances cache locality by dividing matrices into smaller blocks that fit into L1/L2 cache.</li>
      <li><strong>Loop unrolling</strong> reduces loop overhead and increases instruction-level parallelism.</li>
    </ul>
  </li>
</ol>

<p>We’ll use these three programs to compare performance using <strong>Cachegrind</strong> and <strong>perf stat</strong>.</p>

<h2 id="results-with-cachegrind-simulated-cachebehavior">Results with Cachegrind: Simulated Cache Behavior</h2>

<p><strong>Cachegrind</strong> simulates how a program interacts with the CPU’s cache hierarchy. It reports metrics such as instruction counts, cache hits/misses, and memory access patterns — helping identify inefficient memory access.</p>

<div class="language-plaintext highlighter-rouge"><div class="highlight"><pre class="highlight"><code>$ valgrind --tool=cachegrind ./program
</code></pre></div></div>

<ul>
  <li>The detailed profiling data is written to a file named <em>cachegrind.out.{pid}</em></li>
  <li>cg_annotate is a command line tool which summarizes cache-related information per function and annotates source code with color-coded markers for cache events.</li>
  <li>kcachegrind can provide the cachegrind report in GUI form.</li>
</ul>

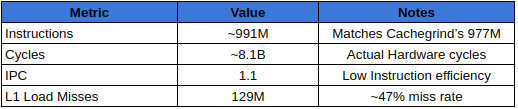
<p>Running Cachegrind on our matrix multiplication programs gave:</p>

<p><img src="https://cdn-images-1.medium.com/max/800/1*5IaQbVKKftlqjkqqLZpgWg.png" alt="image" /></p>

<p>Results from Cachegrind</p>

<p><strong>Key observations:</strong></p>
<ul>
  <li>The <strong>traditional</strong> version suffered from poor <strong>spatial locality</strong>, as elements of matrix B were fetched from distant memory addresses repeatedly.</li>
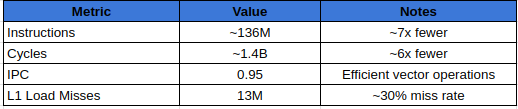
  <li>The <strong>AVX2 basic</strong> version improved performance by vectorizing loads, enhancing both <strong>temporal</strong> and <strong>spatial locality</strong>.</li>
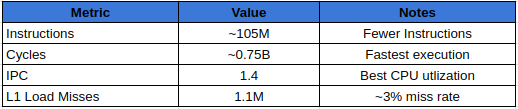
  <li>The <strong>AVX2 optimized</strong> version, with <strong>blocking</strong>, ensured that working sets fit within cache boundaries, minimizing evictions and L1 data misses.</li>
</ul>

<p>Cachegrind provides <strong>reproducible</strong>, deterministic results since it simulates an idealized cache model rather than depending on hardware variability.</p>

<h2 id="results-with-perf-stat-real-hardwareevents"><strong>Results with perf stat: Real hardware events</strong></h2>

<p>While Cachegrind and Callgrind rely on simulation, <strong>perf stat</strong> measures <strong>real hardware events</strong> via CPU performance counters. It reports true execution behavior — including speculation, out-of-order execution, branch prediction, and actual cache misses.</p>

<p>We collected the following events:</p>

<div class="language-plaintext highlighter-rouge"><div class="highlight"><pre class="highlight"><code>perf stat -e instructions,cycles,cache-misses,\
L1-dcache-load-misses,L1-dcache-loads,\
L1-dcache-stores,LLC-load-misses,LLC-loads,\
branch-misses,fp_arith_inst_retired.256b_packed_single\
 ./matrix_variant
</code></pre></div></div>

<p><strong>matrix_traditional:</strong></p>

<p><img src="https://cdn-images-1.medium.com/max/800/1*zvQsLeUpcmuJAJlZOXtrzw.png" alt="image" /></p>

<p>perf stats results for matrix_traditional</p>

<p><strong>matrix_avx2_basics:</strong></p>

<p><img src="https://cdn-images-1.medium.com/max/800/1*pqOiwpJEe3ei1vw-5kC7fA.png" alt="image" /></p>

<p>perf stat results with matrix_avx2_basics</p>

<p><strong>matrix_avx2_optimized:</strong></p>

<p><img src="https://cdn-images-1.medium.com/max/800/1*VPOeYhv6SkfqBe4dj4S7ZA.png" alt="image" /></p>

<p>perf stats results for matrix_avx2_optimized</p>

<p>In summary:</p>
<ul>
  <li><strong>Cachegrind</strong> is ideal for micro-analysis of algorithms and memory access behavior.</li>
  <li><strong>perf stat</strong> is indispensable for measuring true runtime performance and hardware utilization.</li>
</ul>

<h2 id="conclusion">Conclusion</h2>

<p>Performance analysis in Linux is a systematic process of measuring, comparing, and interpreting how programs execute at both the instruction and cache levels.</p>

<p>Tools like <strong>Callgrind</strong> and <strong>Cachegrind</strong> help you understand <strong>how efficiently</strong> your code executes in theory, while <strong>perf stat</strong> helps you measure <strong>how efficiently</strong> it runs in practice.</p>

<p>Through our matrix multiplication case study, we demonstrated how:</p>
<ul>
  <li>AVX2 vectorization reduces instruction count by ~7×.</li>
  <li>Blocking and loop unrolling improve cache utilization, reducing L1 cache misses by ~10×.</li>
  <li>perf stat confirms real performance gains, showing higher IPC and lower CPU cycles.</li>
</ul>

<h2 id="in-essence-combining-valgrind-based-analysis-with-perf-based-hardware-profiling-provides-a-complete-picture-of-software-performancebridging-the-gap-between-code-behavior-and-hardware-efficiency">In essence, combining <strong>Valgrind-based analysis</strong> with <strong>perf-based hardware profiling</strong> provides a complete picture of software performance — bridging the gap between code behavior and hardware efficiency.</h2>

<h2 id="linux-debugtraining"><strong>LINUX DEBUG TRAINING</strong></h2>

<p>If you want to dive deeper, then you can also check out <a href="https://www.udemy.com/course/linux-debug-training-part-1/?referralCode=6534D858AEF9555AB23F"><strong>Part One</strong></a> and <a href="https://www.udemy.com/course/linux-debug-training-part-2/?referralCode=1FAF95060F47194A895F"><strong>Part Two</strong></a> of the <a href="https://www.udemy.com/course/linux-debug-training-part-1/?referralCode=6534D858AEF9555AB23F"><strong>Linux Debugging Training Course</strong></a>. This course is a collaboration between my colleague <a href="https://medium.com/@johnos3747">John OSullivan</a> and myself. We have combined our many years of experience in developing and debugging Linux systems to create a comprehensive technical guide that consolidates our knowledge.</p>

<p>This course offers a structured approach to Linux debugging, covering the entire stack — from <strong>user-space</strong> to <strong>kernel-space</strong>.</p>

<p>Join the course today! Access it via these links: <a href="https://www.udemy.com/course/linux-debug-training-part-1/?referralCode=6534D858AEF9555AB23F">Part 1</a>, <a href="https://www.udemy.com/course/linux-debug-training-part-2/?referralCode=1FAF95060F47194A895F">Part 2</a></p>]]></content><author><name>Manas Marawaha</name><email>manas.marwah@gmail.com</email></author><summary type="html"><![CDATA[Using Cachegrind, perf and flamegraphs to measure and understand Linux performance optimisations.]]></summary></entry><entry><title type="html">Debugging Memory Issues in Linux with Address Sanitizer (ASan)</title><link href="https://mmarwah.github.io/blog/debugging-memory-asan/" rel="alternate" type="text/html" title="Debugging Memory Issues in Linux with Address Sanitizer (ASan)" /><published>2025-01-19T00:00:00+00:00</published><updated>2025-01-19T00:00:00+00:00</updated><id>https://mmarwah.github.io/blog/debugging-memory-asan</id><content type="html" xml:base="https://mmarwah.github.io/blog/debugging-memory-asan/"><![CDATA[<p><img src="https://cdn-images-1.medium.com/max/800/1*2A29ZORDyoVnQyxkzHyTVA.png" alt="image" /></p>

<p>Memory management is vital for efficient resource use, system stability, and performance. In an unmanaged languages like C, poor memory management can cause performance degradation, application crashes, and security vulnerabilities. Addressing these issues is essential to ensure reliable and secure software.</p>

<p>There are powerful tools available to catch memory issues, one of which is Sanitizers. Sanitizers are runtime analysis tools that instrument code during compilation to detect programming errors such as memory issues, undefined behaviours, and race conditions. They rely on <strong>compiler instrumentation</strong> to insert runtime checks around memory accesses and reports violations as they occur. Techniques like <strong>shadow memory</strong> are also employed to track the validity of memory states.</p>

<p>A wide range of sanitizers is available, including <a href="https://github.com/google/sanitizers/wiki/AddressSanitizer">AddressSanitizer</a>, <a href="https://github.com/google/sanitizers/wiki/memorysanitizer">MemorySanitizer</a>, <a href="https://github.com/google/sanitizers/wiki/threadsanitizercppmanual">ThreadSanitizer</a>, and <a href="https://clang.llvm.org/docs/UndefinedBehaviorSanitizer.html">UndefinedBehaviorSanitizer</a>, applicable to both user-space and kernel code. The sanitizers are supported by major OS platforms (Linux, OS X, iOS Simulator, FreeBSD, Android) and compilers like <a href="https://gcc.gnu.org/onlinedocs/gcc/Instrumentation-Options.html">GCC</a> and <a href="https://clang.llvm.org/docs/UsersManual.html#id47">Clang</a>, enabling developers to address issues effectively. Refer to the compiler documentation for specific sanitizer options.</p>

<h2 id="addresssanitizer-asan">AddressSanitizer (ASan)</h2>

<p><a href="https://github.com/google/sanitizers/wiki/AddressSanitizer">AddressSanitizer</a> (ASan) is a runtime memory error detector for C/C++ programs. It uses compiler instrumentation and shadow memory to detect and report memory issues effectively. ASan helps identify common memory-related problems such as:</p>
<ul>
  <li>Use after free (dangling pointer de-reference)</li>
  <li>Heap buffer overflow</li>
  <li>Stack buffer overflow</li>
  <li>Global buffer overflow</li>
  <li>Use after return</li>
  <li>Use after scope</li>
  <li>Initialization order bugs</li>
  <li>Memory leaks</li>
</ul>

<h2 id="installation-andusage">Installation and Usage</h2>

<p>To use AddressSanitizer, the <code class="language-plaintext highlighter-rouge">libasan</code> library must be installed on your system. On Ubuntu, it can be installed using the command: <code class="language-plaintext highlighter-rouge">sudo apt-get install libasan8</code>. Note that the number in <code class="language-plaintext highlighter-rouge">libasan</code> (e.g., <code class="language-plaintext highlighter-rouge">8</code>) corresponds to the compatible version of the library with your GCC version. For example, <code class="language-plaintext highlighter-rouge">libasan8</code> is compatible with GCC version 12.</p>

<p>You can verify this compatibility by running <code class="language-plaintext highlighter-rouge">apt-cache show libasan8</code>. In the “Depends” section of the output, you will find the GCC version it supports—in this case, GCC 12.</p>

<div class="language-plaintext highlighter-rouge"><div class="highlight"><pre class="highlight"><code>ubuntu@sandbox:~$ apt-cache show libasan8
Package: libasan8
...
Depends: gcc-12-base (= 12.3.0-1ubuntu1~22.04), libc6 (&gt;= 2.34), libgcc-s1 (&gt;= 3.3)
...
</code></pre></div></div>

<p>To check gcc version you can use command <code class="language-plaintext highlighter-rouge">gcc --version</code>.</p>

<div class="language-plaintext highlighter-rouge"><div class="highlight"><pre class="highlight"><code>ubuntu@sandbox:~$ gcc --version
gcc (Ubuntu 12.3.0-1ubuntu1~22.04) 12.3.0
...
</code></pre></div></div>

<p>To enable AddressSanitizer (ASan), compile your code with the <code class="language-plaintext highlighter-rouge">-fsanitize=address</code> compiler option. Additionally, it is recommended to include the <code class="language-plaintext highlighter-rouge">-fno-omit-frame-pointer</code> option to ensure a reliable stack trace when an issue is detected.</p>

<div class="language-plaintext highlighter-rouge"><div class="highlight"><pre class="highlight"><code>gcc -fsanitize=address -fno-omit-frame-pointer -g -O1 -o program program.c
</code></pre></div></div>

<h2 id="asan-demonstration">ASan Demonstration</h2>

<p>We will demonstrate AddressSanitizer (ASan) using a <a href="https://github.com/SpecialistLinuxTraining/linux-debug-training/tree/main/Examples/Sanitizers/Asan">sample program</a> intentionally written with three memory-related issues. This will help illustrate how ASan detects and reports such errors during runtime.</p>

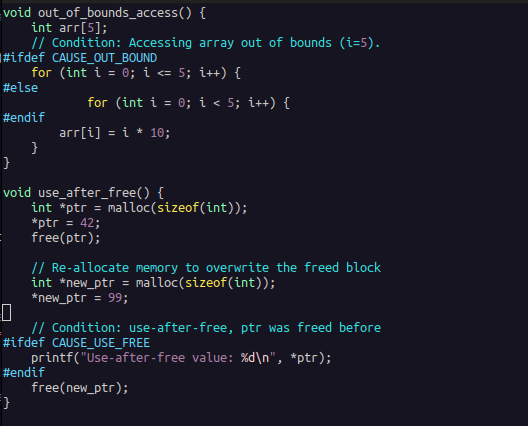
<p><strong>Out-of-bound memory issue code</strong>:</p>

<div class="language-plaintext highlighter-rouge"><div class="highlight"><pre class="highlight"><code>void out_of_bounds_access() {
    int arr[5];
    // Condition: Accessing array out of bounds (i=5).
#ifdef CAUSE_OUT_BOUND
    for (int i = 0; i &lt;= 5; i++) {
#else
    for (int i = 0; i &lt; 5; i++) {
#endif
        arr[i] = i * 10;
    }
}
</code></pre></div></div>

<p>The sample program includes an integer array of size 5. While initializing the array, it writes to the 6th element, which exceeds the array’s upper bound. This out-of-bounds write can be enabled or disabled by defining or undefining the <code class="language-plaintext highlighter-rouge">CAUSE_OUT_BOUND</code> macro.</p>

<p><strong>Use-after-free memory issue code</strong>:</p>

<div class="language-plaintext highlighter-rouge"><div class="highlight"><pre class="highlight"><code>void use_after_free() {
    int *ptr = malloc(sizeof(int));
    *ptr = 42;
    free(ptr);

    // Re-allocate memory to overwrite the freed block
    int *new_ptr = malloc(sizeof(int));
    *new_ptr = 99;

    // Condition: use-after-free, ptr was freed before
#ifdef CAUSE_USE_FREE
    printf("Use-after-free value: %d\n", *ptr);
#endif
    free(new_ptr);
}
</code></pre></div></div>

<p>In the program, we dynamically allocate memory for an integer, assign its address to a pointer <code class="language-plaintext highlighter-rouge">ptr</code>, initialize it with a value, and then free the memory. Subsequently, we reallocate memory, overwriting the previously freed block, and repeat the operation. However, in a print statement, we attempt to access <code class="language-plaintext highlighter-rouge">ptr</code> after it has been freed, resulting in a use-after-free memory issue. This issue can be enabled or disabled by defining or undefining the <code class="language-plaintext highlighter-rouge">CAUSE_USE_FREE</code> macro.</p>

<p><strong>Memory-leak code:</strong></p>

<div class="language-plaintext highlighter-rouge"><div class="highlight"><pre class="highlight"><code>void memory_leak() {
    int *leaked_ptr = malloc(10 * sizeof(int)); 
    for (int i = 0; i &lt; 10; i++) {
        leaked_ptr[i] = i * i;
    }
    printf("Leaked memory initialized.\n");
    // Condition: Memory leak, Intentionally no free here.
#ifndef CAUSE_MEM_LEAK
    free(leaked_ptr);
#endif
}
</code></pre></div></div>

<p>The program allocates memory for 10 integers and initializes it. However, the allocated memory is not freed before the program exits, causing a memory leak. This memory leak issue can be enabled or disabled by defining or undefining the <code class="language-plaintext highlighter-rouge">CAUSE_MEM_LEAK</code> macro.</p>

<p>In the <a href="https://github.com/SpecialistLinuxTraining/linux-debug-training/blob/main/Examples/Sanitizers/Asan/CMakeLists.txt">CMake</a> file, the <code class="language-plaintext highlighter-rouge">-fsanitize=address</code> compiler option is used to enable AddressSanitizer, along with the <code class="language-plaintext highlighter-rouge">-fno-omit-frame-pointer</code> option to ensure a reliable stack trace for effective debugging.</p>

<p>Next, we will build the program using the provided helper <a href="https://github.com/SpecialistLinuxTraining/linux-debug-training/blob/main/Examples/Sanitizers/Asan/build.sh">build</a> script.</p>

<div class="language-plaintext highlighter-rouge"><div class="highlight"><pre class="highlight"><code>ubuntu@sandbox:~/work/Examples/Sanitizers/Asan$ ./build.sh 
-- The C compiler identification is GNU 12.3.0
-- Detecting C compiler ABI info
-- Detecting C compiler ABI info - done
-- Check for working C compiler: /usr/bin/cc - skipped
-- Detecting C compile features
-- Detecting C compile features - done
-- Configuring done
-- Generating done
-- Build files have been written to: /home/ubuntu/work/Examples/Sanitizers/Asan
[ 50%] Building C object CMakeFiles/asan_demo.dir/main.c.o
[100%] Linking C executable asan_demo
[100%] Built target asan_demo
</code></pre></div></div>

<p>The application binary is named <code class="language-plaintext highlighter-rouge">asan_demo</code>. You can use the <code class="language-plaintext highlighter-rouge">ldd</code> command to verify that <code class="language-plaintext highlighter-rouge">libasan</code> is linked to the binary and ensure AddressSanitizer is properly integrated.</p>

<div class="language-plaintext highlighter-rouge"><div class="highlight"><pre class="highlight"><code>ubuntu@sandbox:~/work/Examples/Sanitizers/Asan$ ldd asan_demo 
 linux-vdso.so.1 (0x00007ffc417ed000)
 libasan.so.8 =&gt; /lib/x86_64-linux-gnu/libasan.so.8 (0x00007553be800000)
 libc.so.6 =&gt; /lib/x86_64-linux-gnu/libc.so.6 (0x00007553be400000)
 libm.so.6 =&gt; /lib/x86_64-linux-gnu/libm.so.6 (0x00007553beeff000)
 libgcc_s.so.1 =&gt; /lib/x86_64-linux-gnu/libgcc_s.so.1 (0x00007553beedf000)
 /lib64/ld-linux-x86-64.so.2 (0x00007553bf00a000)
</code></pre></div></div>

<p>Run the program as usual. If AddressSanitizer (ASan) detects a memory error during runtime, it will generate an error message along with a detailed stack trace, pinpointing the source of the issue for easier debugging.</p>

<p><strong>Out-of-bound memory issue report</strong>:</p>

<p>Now, we will execute the program. The first error we encounter is an out-of-bounds error, which occurs when the program tries to write outside the allocated memory for the array.</p>

<div class="language-plaintext highlighter-rouge"><div class="highlight"><pre class="highlight"><code>ubuntu@sandbox:~/work/Examples/Sanitizers/Asan$ ./asan_demo 
=================================================================
==8709==ERROR: AddressSanitizer: stack-buffer-overflow on address 0x7ffd02937fe4 at pc 0x5a828e8fa4a9 bp 0x7ffd02937fa0 sp 0x7ffd02937f90
WRITE of size 4 at 0x7ffd02937fe4 thread T0
    #0 0x5a828e8fa4a8 in out_of_bounds_access /home/ubuntu/work/Examples/Sanitizers/Asan/main.c:16
    #1 0x5a828e8fa5ae in main /home/ubuntu/work/Examples/Sanitizers/Asan/main.c:49
    #2 0x7f7038029d8f in __libc_start_call_main ../sysdeps/nptl/libc_start_call_main.h:58
    #3 0x7f7038029e3f in __libc_start_main_impl ../csu/libc-start.c:392
    #4 0x5a828e8fa1e4 in _start (/home/ubuntu/work/Examples/Sanitizers/Asan/asan_demo+0x11e4)

Address 0x7ffd02937fe4 is located in stack of thread T0 at offset 52 in frame
    #0 0x5a828e8fa2b8 in out_of_bounds_access /home/ubuntu/work/Examples/Sanitizers/Asan/main.c:8

  This frame has 1 object(s):
    [32, 52) 'arr' (line 9) &lt;== Memory access at offset 52 overflows this variable
HINT: this may be a false positive if your program uses some custom stack unwind mechanism, swapcontext or vfork
      (longjmp and C++ exceptions *are* supported)
SUMMARY: AddressSanitizer: stack-buffer-overflow /home/ubuntu/work/Examples/Sanitizers/Asan/main.c:16 in out_of_bounds_access
Shadow bytes around the buggy address:
  0x10002051efa0: 00 00 00 00 00 00 00 00 00 00 00 00 00 00 00 00
  0x10002051efb0: 00 00 00 00 00 00 00 00 00 00 00 00 00 00 00 00
  0x10002051efc0: 00 00 00 00 00 00 00 00 00 00 00 00 00 00 00 00
  0x10002051efd0: 00 00 00 00 00 00 00 00 00 00 00 00 00 00 00 00
  0x10002051efe0: 00 00 00 00 00 00 00 00 00 00 00 00 00 00 00 00
=&gt;0x10002051eff0: 00 00 00 00 00 00 f1 f1 f1 f1 00 00[04]f3 f3 f3
  0x10002051f000: f3 f3 00 00 00 00 00 00 00 00 00 00 00 00 00 00
  0x10002051f010: 00 00 00 00 00 00 00 00 00 00 00 00 00 00 00 00
  0x10002051f020: 00 00 00 00 00 00 00 00 00 00 00 00 00 00 00 00
  0x10002051f030: 00 00 00 00 00 00 00 00 00 00 00 00 00 00 00 00
  0x10002051f040: 00 00 00 00 00 00 00 00 00 00 00 00 00 00 00 00
Shadow byte legend (one shadow byte represents 8 application bytes):
  Addressable:           00
  Partially addressable: 01 02 03 04 05 06 07 
  Heap left redzone:       fa
  Freed heap region:       fd
  Stack left redzone:      f1
  Stack mid redzone:       f2
  Stack right redzone:     f3
  Stack after return:      f5
  Stack use after scope:   f8
  Global redzone:          f9
  Global init order:       f6
  Poisoned by user:        f7
  Container overflow:      fc
  Array cookie:            ac
  Intra object redzone:    bb
  ASan internal:           fe
  Left alloca redzone:     ca
  Right alloca redzone:    cb
==8709==ABORTING
</code></pre></div></div>

<p>Let’s look into the key details from the report.</p>

<div class="language-plaintext highlighter-rouge"><div class="highlight"><pre class="highlight"><code>=================================================================
==8709==ERROR: AddressSanitizer: stack-buffer-overflow on address 0x7ffd02937fe4 at pc 0x5a828e8fa4a9 bp 0x7ffd02937fa0 sp 0x7ffd02937f90
WRITE of size 4 at 0x7ffd02937fe4 thread T0
</code></pre></div></div>

<p>The heading of the error message indicates the type of memory issue detected, along with the address, program counter, and other relevant CPU registers. In this case, the issue is a <strong>stack-buffer-overflow</strong>, caused by a write of size 4 at the specified address.</p>

<div class="language-plaintext highlighter-rouge"><div class="highlight"><pre class="highlight"><code>#0 0x5a828e8fa4a8 in out_of_bounds_access /home/ubuntu/work/Examples/Sanitizers/Asan/main.c:16
#1 0x5a828e8fa5ae in main /home/ubuntu/work/Examples/Sanitizers/Asan/main.c:49
#2 0x7f7038029d8f in __libc_start_call_main ../sysdeps/nptl/libc_start_call_main.h:58
#3 0x7f7038029e3f in __libc_start_main_impl ../csu/libc-start.c:392
#4 0x5a828e8fa1e4 in _start (/home/ubuntu/work/Examples/Sanitizers/Asan/asan_demo+0x11e4)

Address 0x7ffd02937fe4 is located in stack of thread T0 at offset 52 in frame
    #0 0x5a828e8fa2b8 in out_of_bounds_access /home/ubuntu/work/Examples/Sanitizers/Asan/main.c:8
</code></pre></div></div>

<p>The next block is the stack trace. Stack trace is pointing to the function call where the issue occured.</p>

<div class="language-plaintext highlighter-rouge"><div class="highlight"><pre class="highlight"><code>This frame has 1 object(s):
    [32, 52) 'arr' (line 9) &lt;== Memory access at offset 52 overflows this variable
HINT: this may be a false positive if your program uses some custom stack unwind mechanism, swapcontext or vfork
      (longjmp and C++ exceptions *are* supported)
SUMMARY: AddressSanitizer: stack-buffer-overflow /home/ubuntu/work/Examples/Sanitizers/Asan/main.c:16 in out_of_bounds_access
</code></pre></div></div>

<p>The buffer overflow is caused by accessing an associated object, in this case, the array <code class="language-plaintext highlighter-rouge">arr</code>. The array is allocated between offsets 32 and 52, and the access occurs at offset 52, which overflows the last byte of the array.</p>

<div class="language-plaintext highlighter-rouge"><div class="highlight"><pre class="highlight"><code>Shadow bytes around the buggy address:
  0x10002051efa0: 00 00 00 00 00 00 00 00 00 00 00 00 00 00 00 00
  0x10002051efb0: 00 00 00 00 00 00 00 00 00 00 00 00 00 00 00 00
  0x10002051efc0: 00 00 00 00 00 00 00 00 00 00 00 00 00 00 00 00
  0x10002051efd0: 00 00 00 00 00 00 00 00 00 00 00 00 00 00 00 00
  0x10002051efe0: 00 00 00 00 00 00 00 00 00 00 00 00 00 00 00 00
=&gt;0x10002051eff0: 00 00 00 00 00 00 f1 f1 f1 f1 00 00[04]f3 f3 f3
  0x10002051f000: f3 f3 00 00 00 00 00 00 00 00 00 00 00 00 00 00
  0x10002051f010: 00 00 00 00 00 00 00 00 00 00 00 00 00 00 00 00
  0x10002051f020: 00 00 00 00 00 00 00 00 00 00 00 00 00 00 00 00
  0x10002051f030: 00 00 00 00 00 00 00 00 00 00 00 00 00 00 00 00
  0x10002051f040: 00 00 00 00 00 00 00 00 00 00 00 00 00 00 00 00
</code></pre></div></div>

<p>Next, we have shadow memory mappings, which provide metadata about the application memory. Each shadow byte corresponds to 8 bytes of application memory. When an issue occurs, the pointer in the error report points to the shadow memory mapping related to the buggy address.</p>

<p>The addressable memory of the array is surrounded by inaccessible memory zones for protection. In the shadow memory, <code class="language-plaintext highlighter-rouge">f1</code> represents the left guard zone of the stack, and <code class="language-plaintext highlighter-rouge">f3</code> represents the right guard zone. The <code class="language-plaintext highlighter-rouge">0s</code> indicate the addressable memory, while numbers like <code class="language-plaintext highlighter-rouge">[04]</code> represent partially addressable ranges. In this case, <code class="language-plaintext highlighter-rouge">04</code> means that 4 out of 8 bytes are valid, helping to visualize the precise memory boundaries and detect overflows.</p>

<p>Let’s fix the out of bound memory issue and try to find other issues present in our code.</p>

<p><strong>Use-after-free memory issue report:</strong></p>

<p>This time, we encounter a <strong>use-after-free</strong> memory issue. The program attempts to access memory that was freed earlier, which results in undefined behavior.</p>

<div class="language-plaintext highlighter-rouge"><div class="highlight"><pre class="highlight"><code>ubuntu@sandbox:~/work/Examples/Sanitizers/Asan$ ./asan_demo 
=================================================================
==8844==ERROR: AddressSanitizer: heap-use-after-free on address 0x602000000010 at pc 0x5f75065c0502 bp 0x7ffee6601c20 sp 0x7ffee6601c10
READ of size 4 at 0x602000000010 thread T0
    #0 0x5f75065c0501 in use_after_free /home/ubuntu/work/Examples/Sanitizers/Asan/main.c:31
    #1 0x5f75065c0583 in main /home/ubuntu/work/Examples/Sanitizers/Asan/main.c:50
    #2 0x743c3f429d8f in __libc_start_call_main ../sysdeps/nptl/libc_start_call_main.h:58
    #3 0x743c3f429e3f in __libc_start_main_impl ../csu/libc-start.c:392
    #4 0x5f75065c01e4 in _start (/home/ubuntu/work/Examples/Sanitizers/Asan/asan_demo+0x11e4)

0x602000000010 is located 0 bytes inside of 4-byte region [0x602000000010,0x602000000014)
freed by thread T0 here:
    #0 0x743c3f8be470 in __interceptor_free ../../../../src/libsanitizer/asan/asan_malloc_linux.cpp:52
    #1 0x5f75065c04c5 in use_after_free /home/ubuntu/work/Examples/Sanitizers/Asan/main.c:23
    #2 0x5f75065c0583 in main /home/ubuntu/work/Examples/Sanitizers/Asan/main.c:50
    #3 0x743c3f429d8f in __libc_start_call_main ../sysdeps/nptl/libc_start_call_main.h:58

previously allocated by thread T0 here:
    #0 0x743c3f8bf91f in __interceptor_malloc ../../../../src/libsanitizer/asan/asan_malloc_linux.cpp:69
    #1 0x5f75065c04ba in use_after_free /home/ubuntu/work/Examples/Sanitizers/Asan/main.c:21
    #2 0x5f75065c0583 in main /home/ubuntu/work/Examples/Sanitizers/Asan/main.c:50
    #3 0x743c3f429d8f in __libc_start_call_main ../sysdeps/nptl/libc_start_call_main.h:58

SUMMARY: AddressSanitizer: heap-use-after-free /home/ubuntu/work/Examples/Sanitizers/Asan/main.c:31 in use_after_free
Shadow bytes around the buggy address:
  0x0c047fff7fb0: 00 00 00 00 00 00 00 00 00 00 00 00 00 00 00 00
  0x0c047fff7fc0: 00 00 00 00 00 00 00 00 00 00 00 00 00 00 00 00
  0x0c047fff7fd0: 00 00 00 00 00 00 00 00 00 00 00 00 00 00 00 00
  0x0c047fff7fe0: 00 00 00 00 00 00 00 00 00 00 00 00 00 00 00 00
  0x0c047fff7ff0: 00 00 00 00 00 00 00 00 00 00 00 00 00 00 00 00
=&gt;0x0c047fff8000: fa fa[fd]fa fa fa fa fa fa fa fa fa fa fa fa fa
  0x0c047fff8010: fa fa fa fa fa fa fa fa fa fa fa fa fa fa fa fa
  0x0c047fff8020: fa fa fa fa fa fa fa fa fa fa fa fa fa fa fa fa
  0x0c047fff8030: fa fa fa fa fa fa fa fa fa fa fa fa fa fa fa fa
  0x0c047fff8040: fa fa fa fa fa fa fa fa fa fa fa fa fa fa fa fa
  0x0c047fff8050: fa fa fa fa fa fa fa fa fa fa fa fa fa fa fa fa
Shadow byte legend (one shadow byte represents 8 application bytes):
  Addressable:           00
  Partially addressable: 01 02 03 04 05 06 07 
  Heap left redzone:       fa
  Freed heap region:       fd
  Stack left redzone:      f1
  Stack mid redzone:       f2
  Stack right redzone:     f3
  Stack after return:      f5
  Stack use after scope:   f8
  Global redzone:          f9
  Global init order:       f6
  Poisoned by user:        f7
  Container overflow:      fc
  Array cookie:            ac
  Intra object redzone:    bb
  ASan internal:           fe
  Left alloca redzone:     ca
  Right alloca redzone:    cb
==8844==ABORTING
</code></pre></div></div>

<p>Looking into the error report, the issue is caused by a <strong>use-after-free</strong> error. The program attempts to read 4 bytes of memory at a given address that has already been freed.</p>

<div class="language-plaintext highlighter-rouge"><div class="highlight"><pre class="highlight"><code>#0 0x5f75065c0501 in use_after_free /home/ubuntu/work/Examples/Sanitizers/Asan/main.c:31
    #1 0x5f75065c0583 in main /home/ubuntu/work/Examples/Sanitizers/Asan/main.c:50
    #2 0x743c3f429d8f in __libc_start_call_main ../sysdeps/nptl/libc_start_call_main.h:58
    #3 0x743c3f429e3f in __libc_start_main_impl ../csu/libc-start.c:392
    #4 0x5f75065c01e4 in _start (/home/ubuntu/work/Examples/Sanitizers/Asan/asan_demo+0x11e4)
</code></pre></div></div>

<p>The stack trace provides detailed information about the sequence of function calls leading to the issue. It points to the exact location where the <strong>use-after-free</strong> error occurred.</p>

<div class="language-plaintext highlighter-rouge"><div class="highlight"><pre class="highlight"><code>0x602000000010 is located 0 bytes inside of 4-byte region [0x602000000010,0x602000000014)
</code></pre></div></div>

<p>The next line in the error report provides details about the memory block involved in the issue. The allocated memory block was 4 bytes in size, starting at address <code class="language-plaintext highlighter-rouge">0x602000000010</code> and ending at <code class="language-plaintext highlighter-rouge">0x602000000014</code>. The problematic access occurred exactly at the start of this region, at address <code class="language-plaintext highlighter-rouge">0x602000000010</code> (0 bytes offset).</p>

<div class="language-plaintext highlighter-rouge"><div class="highlight"><pre class="highlight"><code>freed by thread T0 here:
    #0 0x743c3f8be470 in __interceptor_free ../../../../src/libsanitizer/asan/asan_malloc_linux.cpp:52
    #1 0x5f75065c04c5 in use_after_free /home/ubuntu/work/Examples/Sanitizers/Asan/main.c:23
    #2 0x5f75065c0583 in main /home/ubuntu/work/Examples/Sanitizers/Asan/main.c:50
    #3 0x743c3f429d8f in __libc_start_call_main ../sysdeps/nptl/libc_start_call_main.h:58

previously allocated by thread T0 here:
    #0 0x743c3f8bf91f in __interceptor_malloc ../../../../src/libsanitizer/asan/asan_malloc_linux.cpp:69
    #1 0x5f75065c04ba in use_after_free /home/ubuntu/work/Examples/Sanitizers/Asan/main.c:21
    #2 0x5f75065c0583 in main /home/ubuntu/work/Examples/Sanitizers/Asan/main.c:50
    #3 0x743c3f429d8f in __libc_start_call_main ../sysdeps/nptl/libc_start_call_main.h:58
</code></pre></div></div>

<p>These two traces provide a history of the object’s lifecycle. The first trace indicates where the memory was freed, pointing to the exact location in the code where the <code class="language-plaintext highlighter-rouge">free</code> operation occurred. The second trace shows where the memory was initially allocated, providing the original location where the memory block was created. Together, these traces help to understand the sequence of events that led to the use-after-free issue.</p>

<div class="language-plaintext highlighter-rouge"><div class="highlight"><pre class="highlight"><code>Shadow bytes around the buggy address:
  0x0c047fff7fb0: 00 00 00 00 00 00 00 00 00 00 00 00 00 00 00 00
  0x0c047fff7fc0: 00 00 00 00 00 00 00 00 00 00 00 00 00 00 00 00
  0x0c047fff7fd0: 00 00 00 00 00 00 00 00 00 00 00 00 00 00 00 00
  0x0c047fff7fe0: 00 00 00 00 00 00 00 00 00 00 00 00 00 00 00 00
  0x0c047fff7ff0: 00 00 00 00 00 00 00 00 00 00 00 00 00 00 00 00
=&gt;0x0c047fff8000: fa fa[fd]fa fa fa fa fa fa fa fa fa fa fa fa fa
  0x0c047fff8010: fa fa fa fa fa fa fa fa fa fa fa fa fa fa fa fa
  0x0c047fff8020: fa fa fa fa fa fa fa fa fa fa fa fa fa fa fa fa
  0x0c047fff8030: fa fa fa fa fa fa fa fa fa fa fa fa fa fa fa fa
  0x0c047fff8040: fa fa fa fa fa fa fa fa fa fa fa fa fa fa fa fa
  0x0c047fff8050: fa fa fa fa fa fa fa fa fa fa fa fa fa fa fa fa
</code></pre></div></div>

<p>In the shadow memory section, we analyze the pointed buggy address. <code class="language-plaintext highlighter-rouge">FA</code> denotes a <strong>Heap redzone</strong>, which is a guard region used to detect buffer overflows. The <code class="language-plaintext highlighter-rouge">fd</code> entry indicates a <strong>Freed heap region</strong>, meaning the memory was previously allocated but has now been freed. The shadow memory points to the exact location that has been freed, but the program attempts to reference it again, leading to the use-after-free error.</p>

<p>Let’s fix the use-after-free and see the remaining issue in our program.</p>

<p><strong>Memory leak error report</strong></p>

<div class="language-plaintext highlighter-rouge"><div class="highlight"><pre class="highlight"><code>ubuntu@sandbox:~/work/Examples/Sanitizers/Asan$ ./asan_demo 
Leaked memory initialized.

=================================================================
==8906==ERROR: LeakSanitizer: detected memory leaks

Direct leak of 40 byte(s) in 1 object(s) allocated from:
    #0 0x7541cdebf91f in __interceptor_malloc ../../../../src/libsanitizer/asan/asan_malloc_linux.cpp:69
    #1 0x5ccf6207745a in memory_leak /home/ubuntu/work/Examples/Sanitizers/Asan/main.c:37
    #2 0x5ccf620774ca in main /home/ubuntu/work/Examples/Sanitizers/Asan/main.c:51
    #3 0x7541cda29d8f in __libc_start_call_main ../sysdeps/nptl/libc_start_call_main.h:58

SUMMARY: AddressSanitizer: 40 byte(s) leaked in 1 allocation(s).
</code></pre></div></div>

<p>AddressSanitizer (ASan) is reporting a <strong>memory leak</strong>. The stack trace points to the location where the leaked memory was allocated, providing context on where the memory was not properly freed. In the summary, ASan also reports the total number of leaked bytes, helping to quantify the memory that was allocated but not deallocated, thus causing the leak.</p>

<p>The added instrumentation significantly slows down the program and it is recommended to use ASan in development and testing environment only. You can refer to various ASAN options <a href="https://github.com/google/sanitizers/wiki/addresssanitizerflags">here</a>.</p>

<p>I hope this demonstration was helpful for you to understand the address sanitizer and its usage.</p>

<h2 id="linux-debugtraining"><strong>LINUX DEBUG TRAINING</strong></h2>

<p>If you want to dive deeper, then you can also check out <a href="https://www.udemy.com/course/linux-debug-training-part-1/?referralCode=6534D858AEF9555AB23F"><strong>Part One</strong></a> and <a href="https://www.udemy.com/course/linux-debug-training-part-2/?referralCode=1FAF95060F47194A895F"><strong>Part Two</strong></a> of the <a href="https://www.udemy.com/course/linux-debug-training-part-1/?referralCode=6534D858AEF9555AB23F"><strong>Linux Debugging Training Course</strong></a>. This course is a collaboration between my colleague <a href="https://medium.com/@johnos3747">John OSullivan</a> and myself. We have combined our many years of experience in developing and debugging Linux systems to create a comprehensive technical guide that consolidates our knowledge.</p>

<p>This course offers a structured approach to Linux debugging, covering the entire stack — from <strong>user-space</strong> to <strong>kernel-space</strong>.</p>

<p>Join the course today! Access it via these links: <a href="https://www.udemy.com/course/linux-debug-training-part-1/?referralCode=6534D858AEF9555AB23F">Part 1</a>, <a href="https://www.udemy.com/course/linux-debug-training-part-2/?referralCode=1FAF95060F47194A895F">Part 2</a></p>]]></content><author><name>Manas Marawaha</name><email>manas.marwah@gmail.com</email></author><summary type="html"><![CDATA[Using AddressSanitizer to detect memory issues like buffer overflow, out-of-bound access and memory leaks.]]></summary></entry><entry><title type="html">Kexec &amp;amp; Kdump</title><link href="https://mmarwah.github.io/blog/kexec-kdump/" rel="alternate" type="text/html" title="Kexec &amp;amp; Kdump" /><published>2024-09-06T00:00:00+00:00</published><updated>2024-09-06T00:00:00+00:00</updated><id>https://mmarwah.github.io/blog/kexec-kdump</id><content type="html" xml:base="https://mmarwah.github.io/blog/kexec-kdump/"><![CDATA[<h2 id="kexec-kdump">Kexec &amp; Kdump</h2>

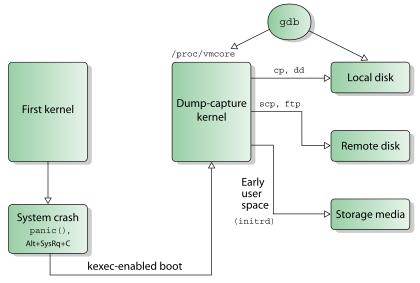
<p>Kexec and Kdump are mechanisms in the Linux kernel used to capture and recover the kernel memory snapshot (/proc/vmcore) after a kernel panic, without requiring a full system reboot. It enables the preservation and retrieval of the system kernel’s memory image, which can later be used for detailed post-mortem analysis to diagnose the cause of the crash.</p>

<p><img src="https://cdn-images-1.medium.com/max/800/1*EK0NtBujM3NQ2hUCrw2f3w.png" alt="image" /></p>

<p>Image Credit: Wikipedia</p>
<ul>
  <li>On panic, the kernel’s kexec support allows the execution of a “dump-capture” kernel directly from the crashed kernel.</li>
  <li>The “dump-capture” or Kdump kernel includes only the essential device drivers and features required to capture the crash dump.</li>
  <li>Kexec reserves a small section of memory in the RAM for the dump-capture kernel.</li>
  <li>Use <code class="language-plaintext highlighter-rouge">crashkernel</code> kernel boot parameter to specify the memory region for dump-capture kernel.</li>
  <li>The <code class="language-plaintext highlighter-rouge">kexec -p</code> command loads the dump-capture kernel into the reserved memory.</li>
</ul>

<div class="language-plaintext highlighter-rouge"><div class="highlight"><pre class="highlight"><code>/sbin/kexec -p - command-line="BOOT_IMAGE=/boot/vmlinuz-6.8.0–40-generic root=UUID=3e78aa08-eb2d-4019-b50c-ade108081f72 ro quiet splash vt.handoff=7 reset_devices systemd.unit=kdump-tools-dump.service nr_cpus=1 irqpoll nousb" - initrd=/var/lib/kdump/initrd.img /var/lib/kdump/vmlinuz
</code></pre></div></div>

<ul>
  <li>After booting from the “dump-capture” kernel, the kernel coredump found at <code class="language-plaintext highlighter-rouge">/proc/vmcore</code> can be stored as a file on the local filesystem or sent remotely over NFS or SSH.</li>
</ul>

<h2 id="kexec--kdump-configuration-on-ubuntu-2204-environment">Kexec &amp; Kdump configuration on Ubuntu 22.04 environment</h2>

<p>The Linux kernel <a href="https://docs.kernel.org/admin-guide/kdump/kdump.html">documentation</a> explains the kexec and kdump mechanisms and their configuration in detail. This post discusses how to configure kexec and kdump in an Ubuntu 22.04 environment.</p>

<h2 id="installation-and-configuration">Installation and Configuration</h2>

<p><code class="language-plaintext highlighter-rouge">linux-crashdump</code> package provides all necessary tools to configure Kexec and Kdump.</p>

<div class="language-plaintext highlighter-rouge"><div class="highlight"><pre class="highlight"><code>sudo apt install linux-crashdump
</code></pre></div></div>

<p>During the package installation, when prompted, select ‘Yes’ to allow kexec-tools to handle reboots.</p>

<div class="language-plaintext highlighter-rouge"><div class="highlight"><pre class="highlight"><code>┌────────────────────────┤ Configuring kexec-tools ├────────────────────────┐
 │                                                                           │
 │ If you choose this option, a system reboot will trigger a restart into a  │
 │ kernel loaded by kexec instead of going through the full system boot      │
 │ loader process.                                                           │
 │                                                                           │
 │ Should kexec-tools handle reboots?                                        │
 │                                                                           │
 │                                                                  │
 │                                                                           │
 └───────────────────────────────────────────────────────────────────────────┘
</code></pre></div></div>

<p>Select ‘Yes’ to enable Kdump.</p>

<div class="language-plaintext highlighter-rouge"><div class="highlight"><pre class="highlight"><code>┌────────────────────────┤ Configuring kdump-tools ├────────────────────────┐
 │                                                                           │
 │ If you choose this option, the kdump-tools mechanism will be enabled. A   │
 │ reboot is still required in order to enable the crashkernel kernel        │
 │ parameter.                                                                │
 │                                                                           │
 │ Should kdump-tools be enabled by default?                                 │
 │                                                                           │
 │                                                                  │
 │                                                                           │
 └───────────────────────────────────────────────────────────────────────────┘
</code></pre></div></div>

<p>After installation, you can confirm the status of kexec and kdump by checking the respective configuration files.</p>

<div class="language-plaintext highlighter-rouge"><div class="highlight"><pre class="highlight"><code># Invoke root user using 'sudo su' command.

root@sandbox:~# cat /etc/default/kexec | grep LOAD_KEXEC
LOAD_KEXEC=true

root@sandbox:~# cat /etc/default/kdump-tools | grep USE_KDUMP
# USE_KDUMP - controls kdump will be configured
USE_KDUMP=1
</code></pre></div></div>

<p>You can also manually enable the Kexec and Kdump functionality using <code class="language-plaintext highlighter-rouge">dpkg-reconfigure kexec-tools</code> and <code class="language-plaintext highlighter-rouge">dpkg-reconfigure kdump-tools</code>.</p>

<h3 id="increase-the-reserved-memory-size-for-dump-capture-kernel">Increase the reserved memory size for dump-capture kernel</h3>

<p>“/etc/default/grub.d/kdump-tools.cfg” defines the <code class="language-plaintext highlighter-rouge">crashkernel</code> boot parameter, which is appended to the kernel command line. I found that the default size was insufficient for my needs, so I increased it. Depending on the size of your RAM, you may need to adjust the <code class="language-plaintext highlighter-rouge">crashkernel</code> boot parameter accordingly.</p>

<div class="language-plaintext highlighter-rouge"><div class="highlight"><pre class="highlight"><code>root@sandbox:~# cat /etc/default/grub.d/kdump-tools.cfg 
GRUB_CMDLINE_LINUX_DEFAULT="$GRUB_CMDLINE_LINUX_DEFAULT crashkernel=2G-:512M"

root@sandbox:~# update-grub
</code></pre></div></div>

<h3 id="install-linux-debug-symbols-on-ubuntu2204">Install Linux debug symbols on Ubuntu 22.04</h3>

<p>Linux debug symbols or the <code class="language-plaintext highlighter-rouge">vmlinux</code> file is required to analyze the core dump. Follow the below given instructions to install <code class="language-plaintext highlighter-rouge">vmlinux</code> on Ubuntu 22.04.</p>
<ul>
  <li>Import the signing key</li>
</ul>

<div class="language-plaintext highlighter-rouge"><div class="highlight"><pre class="highlight"><code>sudo apt install ubuntu-dbgsym-keyring
</code></pre></div></div>

<ul>
  <li>Create a ddebs.list file</li>
</ul>

<div class="language-plaintext highlighter-rouge"><div class="highlight"><pre class="highlight"><code>echo "deb http://ddebs.ubuntu.com $(lsb_release -cs) main restricted universe multiverse
deb http://ddebs.ubuntu.com $(lsb_release -cs)-updates main restricted universe multiverse
deb http://ddebs.ubuntu.com $(lsb_release -cs)-proposed main restricted universe multiverse" | \
sudo tee -a /etc/apt/sources.list.d/ddebs.list
</code></pre></div></div>

<ul>
  <li>Install Linux debug symbols</li>
</ul>

<div class="language-plaintext highlighter-rouge"><div class="highlight"><pre class="highlight"><code>sudo apt-get update
sudo apt-get install linux-image-`uname -r`-dbgsym
</code></pre></div></div>

<div class="language-plaintext highlighter-rouge"><div class="highlight"><pre class="highlight"><code>root@sandbox:/home/ubuntu# ls /lib/debug/boot/
vmlinux-6.8.0–40-generic
</code></pre></div></div>

<p>Reboot the system to enable the kdump-tools.</p>

<p>At any time, if you choose to update the Kdump and Kexec configuration, you can reload the Kdump using the command <code class="language-plaintext highlighter-rouge">kdump-config reload</code>.</p>

<div class="language-plaintext highlighter-rouge"><div class="highlight"><pre class="highlight"><code>root@sandbox:~# kdump-config reload
 * unloaded kdump kernel
 * Creating symlink /var/lib/kdump/vmlinuz
 * Creating symlink /var/lib/kdump/initrd.img
 * loaded kdump kernel
</code></pre></div></div>

<h2 id="verify-kdump-configuration-afterreboot">Verify Kdump configuration after reboot</h2>

<p>After reboot, verify the status of kdump using <code class="language-plaintext highlighter-rouge">kdump-config show</code> command.</p>

<div class="language-plaintext highlighter-rouge"><div class="highlight"><pre class="highlight"><code>root@sandbox:~# kdump-config show
DUMP_MODE:              kdump
USE_KDUMP:              1
KDUMP_COREDIR:          /var/crash
crashkernel addr: 0xb000000
   /var/lib/kdump/vmlinuz: symbolic link to /boot/vmlinuz-6.8.0-40-generic
kdump initrd:
   /var/lib/kdump/initrd.img: symbolic link to /var/lib/kdump/initrd.img-6.8.0-40-generic
current state:    ready to kdump

kexec command:
  /sbin/kexec -p --command-line="BOOT_IMAGE=/boot/vmlinuz-6.8.0-40-generic root=UUID=3e78aa08-eb2d-4019-b50c-ade108081f72 ro quiet splash vt.handoff=7 reset_devices systemd.unit=kdump-tools-dump.service nr_cpus=1 irqpoll nousb" --initrd=/var/lib/kdump/initrd.img /var/lib/kdump/vmlinuz
</code></pre></div></div>

<p>“Ready to kdump” indicates that your kdump configuration is correct.</p>

<p>Check the <code class="language-plaintext highlighter-rouge">crashkernel</code> parameter in kernel command line.</p>

<div class="language-plaintext highlighter-rouge"><div class="highlight"><pre class="highlight"><code>root@sandbox:/home/ubuntu# cat /proc/cmdline
BOOT_IMAGE=/boot/vmlinuz-6.8.0-40-generic root=UUID=3e78aa08-eb2d-4019-b50c-ade108081f72 ro quiet splash crashkernel=2G-:512M vt.handoff=7
</code></pre></div></div>

<p>Check the kernel boot logs to verify the memory reservation for the kdump kernel.</p>

<div class="language-plaintext highlighter-rouge"><div class="highlight"><pre class="highlight"><code>root@sandbox:/home/ubuntu# dmesg | grep -i crash
...
[    0.004218] crashkernel reserved: 0x000000000b000000 - 0x000000002b000000 (512 MB)
</code></pre></div></div>

<h2 id="trigger-the-crash-kernel-the-moment-oftruth">Trigger the crash kernel (the moment of truth!)</h2>

<p>There are various ways to trigger a panic in the Linux kernel. For example, using a custom kernel module to induce a panic. However, we will use the ‘SysRq’ to trigger a panic and crash the kernel. You can read more about SysRq <a href="https://docs.kernel.org/admin-guide/sysrq.html">here</a>.</p>

<div class="language-plaintext highlighter-rouge"><div class="highlight"><pre class="highlight"><code># Invoke root user using 'sudo su' command.
# Crash the kernel using SysRq trigger
root@sandbox:~# echo c &gt; /proc/sysrq-trigger
</code></pre></div></div>

<p>Upon triggering a kernel crash, the system memory is preserved, and the system boots directly into the kdump kernel, bypassing the usual BIOS initialisation process. This transition happens quickly, and the dump-capture process begins immediately.</p>

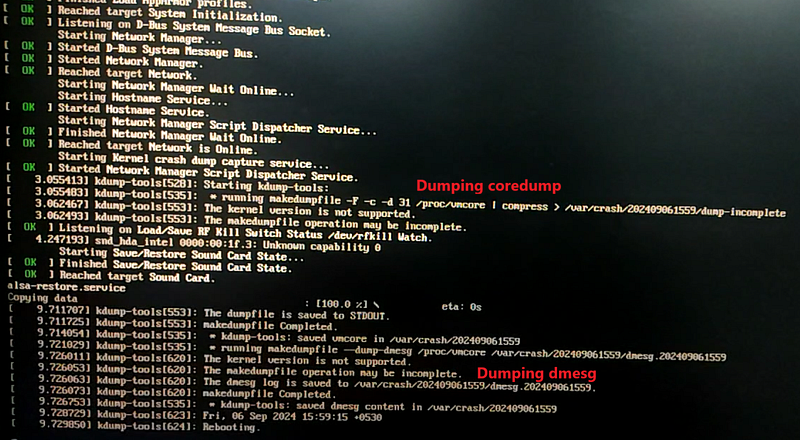
<p>On Ubuntu, it’s important to note that the system does not boot into the normal desktop mode at this point. To observe the kdump kernel capturing the memory dump, switch to a virtual terminal (press <strong>Ctrl+Alt+F3</strong> after the crash) to see the dump-capture logs in action. During this phase, the kdump kernel uses the <code class="language-plaintext highlighter-rouge">makedumpfile</code> utility to capture <code class="language-plaintext highlighter-rouge">/proc/vmcore</code> and <code class="language-plaintext highlighter-rouge">dmesg</code> into the <code class="language-plaintext highlighter-rouge">/var/crash</code> directory. Refer the snapshot showing logs from kdump kernel.</p>

<p>After the memory dump is saved, the kdump kernel reboots, and the system then boots into the normal desktop mode. Because this process happens quickly, it may seem like the system has booted normally right after the crash, but the crash dump is completed in the background beforehand.</p>

<p><img src="https://cdn-images-1.medium.com/max/800/1*PpUv9rb_ZL5kZvXU5aUXOg.png" alt="image" />
Kdump kernel dumping vmcore file in /var/crash</p>

<h2 id="core-dumpanalysis">Core dump analysis</h2>

<p>The core dumps are collected in <code class="language-plaintext highlighter-rouge">/var/crash</code> within a directory named with a date timestamp. The <code class="language-plaintext highlighter-rouge">/proc/vmcore</code> is saved in a file named <code class="language-plaintext highlighter-rouge">dump.&lt;timestamp&gt;</code>, and the <code class="language-plaintext highlighter-rouge">dmesg</code> output is saved in a file named <code class="language-plaintext highlighter-rouge">dmesg.&lt;timestamp&gt;</code>.</p>

<div class="language-plaintext highlighter-rouge"><div class="highlight"><pre class="highlight"><code>root@sandbox:/var/crash# tree 
.
├── 202409061559
│   ├── dmesg.202409061559
│   └── dump.202409061559
├── kdump_lock
├── kexec_cmd
└── linux-image-6.8.0-40-generic-202409061210.crash

1 directory, 5 files
</code></pre></div></div>

<h3 id="core-dump-post-mortem-analysis-using-crashutility">Core dump post-mortem analysis using crash utility</h3>

<p>We can use the <code class="language-plaintext highlighter-rouge">crash</code> utility to perform a post-mortem analysis of the core dump. Load the <code class="language-plaintext highlighter-rouge">vmlinux</code> file and the core dump into the <code class="language-plaintext highlighter-rouge">crash</code> utility to analyze the cause of the crash. For example, using the <code class="language-plaintext highlighter-rouge">bt</code> (backtrace) command within <code class="language-plaintext highlighter-rouge">crash</code>, you can determine that the panic was triggered by <code class="language-plaintext highlighter-rouge">sysrq_handle_crash</code></p>

<div class="language-plaintext highlighter-rouge"><div class="highlight"><pre class="highlight"><code>root@sandbox:/var/crash/202409061559# crash /usr/lib/debug/boot/vmlinux-6.8.0-40-generic dump.202409061559

WARNING: kernel version inconsistency between vmlinux and dumpfile

      KERNEL: /usr/lib/debug/boot/vmlinux-6.8.0-40-generic
    DUMPFILE: dump.202409061559  [PARTIAL DUMP]
        CPUS: 32
        DATE: Fri Sep  6 15:59:05 IST 2024
      UPTIME: 00:34:52
LOAD AVERAGE: 0.20, 0.43, 0.36
       TASKS: 947
    NODENAME: sandbox
     RELEASE: 6.8.0-40-generic
     VERSION: #40~22.04.3-Ubuntu SMP PREEMPT_DYNAMIC Tue Jul 30 17:30:19 UTC 2
     MACHINE: x86_64  (2000 Mhz)
      MEMORY: 15.7 GB
       PANIC: "Kernel panic - not syncing: sysrq triggered crash"
         PID: 2711
     COMMAND: "bash"
        TASK: ffff952455685200  [THREAD_INFO: ffff952455685200]
         CPU: 14
       STATE: TASK_RUNNING (PANIC)

crash&gt; bt
PID: 2711   TASK: ffff952455685200  CPU: 14  COMMAND: "bash"
 #0 [ffffbab508593980] machine_kexec at ffffffffadab753b
 #1 [ffffbab5085939e0] __crash_kexec at ffffffffadc2a4f3
 #2 [ffffbab508593aa8] panic at ffffffffadb00704
 #3 [ffffbab508593b28] sysrq_handle_crash at ffffffffae4d5dda
 #4 [ffffbab508593b38] __handle_sysrq at ffffffffae4d659e
 #5 [ffffbab508593b80] write_sysrq_trigger at ffffffffae4d6e32
 #6 [ffffbab508593bb0] proc_reg_write at ffffffffadfa1069
 #7 [ffffbab508593bd0] vfs_write at ffffffffadee08ed
 #8 [ffffbab508593c68] ksys_write at ffffffffadee1033
 #9 [ffffbab508593ca8] __x64_sys_write at ffffffffadee10e9
#10 [ffffbab508593cb8] x64_sys_call at ffffffffada07891
#11 [ffffbab508593cc8] do_syscall_64 at ffffffffaebfccc1
#12 [ffffbab508593f50] entry_SYSCALL_64_after_hwframe at ffffffffaee00130
    RIP: 0000737a90d14887  RSP: 00007ffd21746498  RFLAGS: 00000246
    RAX: ffffffffffffffda  RBX: 0000000000000002  RCX: 0000737a90d14887
    RDX: 0000000000000002  RSI: 000060d472c243a0  RDI: 0000000000000001
    RBP: 000060d472c243a0   R8: 0000000000000000   R9: 000060d472c243a0
    R10: 000060d472c24240  R11: 0000000000000246  R12: 0000000000000002
    R13: 0000737a90e1b780  R14: 0000737a90e17600  R15: 0000737a90e16a00
    ORIG_RAX: 0000000000000001  CS: 0033  SS: 002b
crash&gt;
</code></pre></div></div>

<p>We can also investigate various aspects of the system at the time of the crash, such as the process table, virtual memory, and more. To gain a deeper understanding of the <code class="language-plaintext highlighter-rouge">crash</code> utility and its capabilities, you can refer to the documentation available on the crash utility <a href="https://crash-utility.github.io/crash_whitepaper.html">documentation page</a>.</p>

<h3 id="notes-ongdb">Notes on GDB</h3>

<p>Kdump uses the <code class="language-plaintext highlighter-rouge">makedump</code> utility to dump <code class="language-plaintext highlighter-rouge">/proc/vmcore</code> into a dump file. By default, <code class="language-plaintext highlighter-rouge">makedump</code> compresses the dump file in a format that only the <code class="language-plaintext highlighter-rouge">crash</code> utility can read. To generate an ELF format that <code class="language-plaintext highlighter-rouge">gdb</code> can understand, you can modify the <code class="language-plaintext highlighter-rouge">MAKEDUMP_ARGS</code> configuration option in <code class="language-plaintext highlighter-rouge">/etc/default/kdump-tools</code> .</p>

<div class="language-plaintext highlighter-rouge"><div class="highlight"><pre class="highlight"><code>MAKEDUMP_ARGS="-E -d 31"
</code></pre></div></div>

<h2 id="references">References</h2>
<ul>
  <li><a href="https://ubuntu.com/server/docs/debug-symbol-packages"><strong>Debug symbol packages</strong></a></li>
  <li><a href="https://ubuntu.com/server/docs/kernel-crash-dump"><strong>Kernel crash dump</strong></a></li>
  <li><a href="https://docs.kernel.org/admin-guide/kdump/kdump.html"><strong>The Linux Kernel</strong></a></li>
  <li><a href="https://crash-utility.github.io/crash_whitepaper.html"><strong>White Paper: Crash Utility</strong></a></li>
</ul>

<h2 id="linux-debugtraining"><strong>LINUX DEBUG TRAINING</strong></h2>

<p>If you want to dive deeper, then you can also check out <a href="https://www.udemy.com/course/linux-debug-training-part-1/?referralCode=6534D858AEF9555AB23F"><strong>Part One</strong></a> and <a href="https://www.udemy.com/course/linux-debug-training-part-2/?referralCode=1FAF95060F47194A895F"><strong>Part Two</strong></a> of the <a href="https://www.udemy.com/course/linux-debug-training-part-1/?referralCode=6534D858AEF9555AB23F"><strong>Linux Debugging Training Course</strong></a>. This course is a collaboration between my colleague <a href="https://medium.com/@johnos3747">John OSullivan</a> and myself. We have combined our many years of experience in developing and debugging Linux systems to create a comprehensive technical guide that consolidates our knowledge.</p>

<p>This course offers a structured approach to Linux debugging, covering the entire stack — from <strong>user-space</strong> to <strong>kernel-space</strong>.</p>

<p>Join the course today! Access it via these links: <a href="https://www.udemy.com/course/linux-debug-training-part-1/?referralCode=6534D858AEF9555AB23F">Part 1</a>, <a href="https://www.udemy.com/course/linux-debug-training-part-2/?referralCode=1FAF95060F47194A895F">Part 2</a></p>]]></content><author><name>Manas Marawaha</name><email>manas.marwah@gmail.com</email></author><summary type="html"><![CDATA[How Kexec and Kdump capture kernel memory snapshots after a panic without a full reboot.]]></summary></entry><entry><title type="html">Building the Linux Perf Tool from Scratch</title><link href="https://mmarwah.github.io/blog/building-perf-tool/" rel="alternate" type="text/html" title="Building the Linux Perf Tool from Scratch" /><published>2023-11-06T00:00:00+00:00</published><updated>2023-11-06T00:00:00+00:00</updated><id>https://mmarwah.github.io/blog/building-perf-tool</id><content type="html" xml:base="https://mmarwah.github.io/blog/building-perf-tool/"><![CDATA[<h2 id="building-linux-perftool">Building Linux Perf tool</h2>

<p><img src="https://cdn-images-1.medium.com/max/800/1*ftioCEIKQcyRr6Yjbnod1A.png" alt="image" /></p>

<p>The perf tool is a part of the Linux kernel code base. The standard Linux distribution package for the perf tool includes only basic support, lacking the full array of options. This necessitates building the perf tool from scratch with all options enabled. Here are the steps to build perf from scratch:</p>

<p>Step 1: Download the Kernel source code</p>

<div class="language-plaintext highlighter-rouge"><div class="highlight"><pre class="highlight"><code>curl -o linux-source.{VERSION}.tar.gz https://mirrors.edge.kernel.org/pub/linux/kernel/v6.x/linux-{VERSION}.tar.gz
</code></pre></div></div>

<p>Note: Replace the kernel version. I am using Version 6.2</p>

<p>Step 2: Extract the Kernel source package</p>

<div class="language-plaintext highlighter-rouge"><div class="highlight"><pre class="highlight"><code>tar -xvf linux-source.{VERSION}.tar.gz
</code></pre></div></div>

<p>Step 3: Install build essential packages.</p>

<div class="language-plaintext highlighter-rouge"><div class="highlight"><pre class="highlight"><code>sudo apt install make gcc flex bison pkg-config
</code></pre></div></div>

<p>Step 4: Install the required libraries to enable all the feature in perf</p>

<p>libzstd1<br />
libdwarf-dev<br />
libdw-dev<br />
binutils-dev<br />
libcap-dev<br />
libelf-dev<br />
libnuma-dev<br />
python3<br />
python3-dev<br />
python-setuptools<br />
libssl-dev<br />
libunwind-dev<br />
libdwarf-dev <br />
zlib1g-dev <br />
liblzma-dev <br />
libaio-dev<br />
libtraceevent-dev<br />
debuginfod<br />
libpfm4-dev<br />
libslang2-dev<br />
systemtap-sdt-dev<br />
libperl-dev<br />
binutils-dev<br />
libbabeltrace-dev<br />
libiberty-dev<br />
libzstd-dev</p>

<div class="language-plaintext highlighter-rouge"><div class="highlight"><pre class="highlight"><code>sudo apt install libzstd1 libdwarf-dev libdw-dev binutils-dev libcap-dev libelf-dev libnuma-dev python3 python3-dev python-setuptools libssl-dev libunwind-dev libdwarf-dev zlib1g-dev liblzma-dev libaio-dev libtraceevent-dev debuginfod libpfm4-dev libslang2-dev systemtap-sdt-dev libperl-dev binutils-dev libbabeltrace-dev libiberty-dev libzstd-dev
</code></pre></div></div>

<p>Step 5: Step into the perf directory and make</p>

<div class="language-plaintext highlighter-rouge"><div class="highlight"><pre class="highlight"><code>manas@sandbox: ~/kernel cd linux-6.2/tools/perf
manas@sandbox: ~/kernel/linux-6.2/tools/perf make
</code></pre></div></div>

<p>The build configuration will display the supported features. In this case, all the required libraries are present. The build configuration will also indicate any missing libraries if they are not present in the system</p>

<div class="language-plaintext highlighter-rouge"><div class="highlight"><pre class="highlight"><code>Auto-detecting system features:
…                               dwarf: [ on ]
…                  dwarf_getlocations: [ on ]
…                               glibc: [ on ]
…                              libbfd: [ on ]
…                      libbfd-buildid: [ on ]
…                              libcap: [ on ]
…                              libelf: [ on ]
…                             libnuma: [ on ]
…              numa_num_possible_cpus: [ on ]
…                             libperl: [ on ]
…                           libpython: [ on ]
…                           libcrypto: [ on ]
…                           libunwind: [ on ]
…                  libdw-dwarf-unwind: [ on ]
…                                zlib: [ on ]
…                                lzma: [ on ]
…                           get_cpuid: [ on ]
…                                 bpf: [ on ]
…                              libaio: [ on ]
…                             libzstd: [ on ]
</code></pre></div></div>

<p><strong>UPDATE</strong>: If building for kernel version 6.5. Suppress the warning options</p>

<div class="language-plaintext highlighter-rouge"><div class="highlight"><pre class="highlight"><code>make -C tools/perf/ WERROR=0
</code></pre></div></div>

<p>Step 6: Check perf version</p>

<div class="language-plaintext highlighter-rouge"><div class="highlight"><pre class="highlight"><code>manas@sandbox: ~/kernel/linux-6.2/tools/perf$ ./perf --version
perf version 6.2.0
</code></pre></div></div>]]></content><author><name>Manas Marawaha</name><email>manas.marwah@gmail.com</email></author><summary type="html"><![CDATA[Step-by-step guide to building the Linux perf tool with all options enabled.]]></summary></entry><entry><title type="html">Dual Boot Ubuntu 22.04 alongside Ubuntu 22.04</title><link href="https://mmarwah.github.io/blog/dual-boot-ubuntu/" rel="alternate" type="text/html" title="Dual Boot Ubuntu 22.04 alongside Ubuntu 22.04" /><published>2023-03-24T00:00:00+00:00</published><updated>2023-03-24T00:00:00+00:00</updated><id>https://mmarwah.github.io/blog/dual-boot-ubuntu</id><content type="html" xml:base="https://mmarwah.github.io/blog/dual-boot-ubuntu/"><![CDATA[<h2 id="dual-boot-ubuntu-2204-alongside-ubuntu2204">Dual Boot Ubuntu 22.04 alongside Ubuntu 22.04</h2>

<p>This article discusses installing two different versions of Ubuntu (or two copies of the same version of Ubuntu side by side) in a “Dual boot” configuration. We are using a UEFI-based system as opposed to a legacy BIOS-based system to achieve our goal. The goal is to create a system which allows us to switch between the two instances of the operating system by switching the EFI boot order rather than rely on having to make manual selections from a GRUB menu.</p>

<p>Note: Although we are using the Ubuntu distribution here, the process is applicable to other Linux distributions. For example Fedora alongside Fedora, etc.</p>

<p>Step 1: Create a bootable Ubuntu USB drive. Refer to the following tutorial for instructions.</p>

<p><a href="https://ubuntu.com/tutorials/create-a-usb-stick-on-ubuntu#1-overview">https://ubuntu.com/tutorials/create-a-usb-stick-on-ubuntu#1-overview</a></p>

<p>Step 2: Boot your system from the USB key by selecting the USB option from the boot menu (or selecting that option in your bios boot order configuration). These options are normally accessible by hitting designated keys during the early boot phase. For example on some systems hitting F7 will bring up a boot menu and hitting the DEL or ESC key will bring up the Bios Configuration Menu.</p>

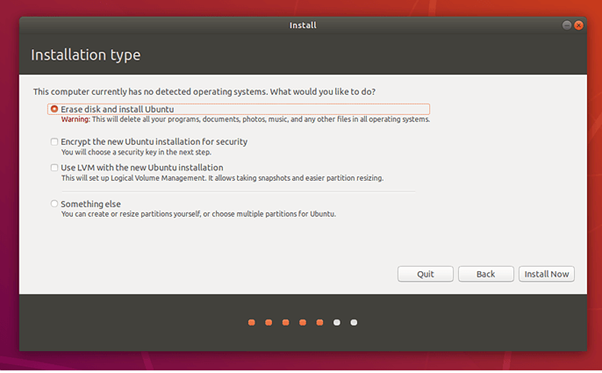
<p>Step 3: After booting from USB key and starting the installation process, the installer will prompt for a disk location to install the Ubuntu. Select the “<strong>Something else</strong>” option.</p>

<p><img src="https://cdn-images-1.medium.com/max/800/1*xK3_aHFjc66a5Az5cNr-3g.png" alt="image" />
Ubuntu installer screen</p>

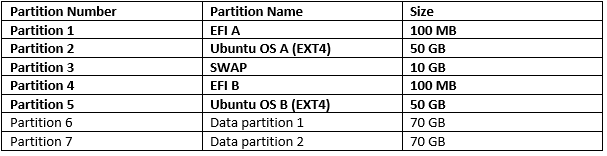
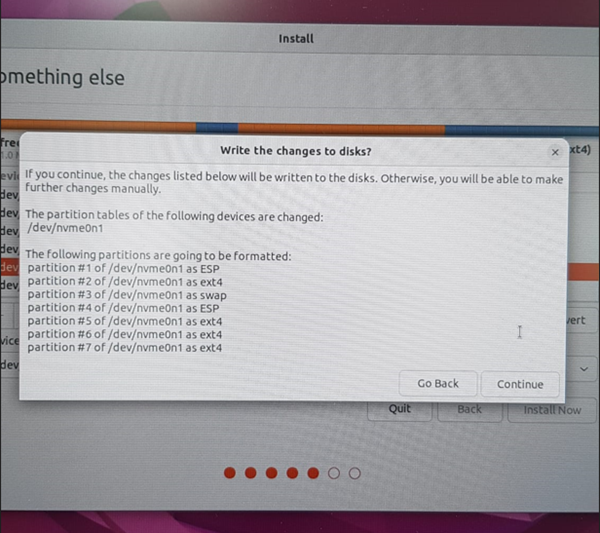
<p>Step 4: Create the partitions as defined in the table below. For this example we are using a 250 GB disk and we have sized the partitions accordingly. Given the size of the disk you are using you can change the size or scheme of the partition but the partitions marked in **BOLD **are essential for dual boot.</p>

<p><img src="https://cdn-images-1.medium.com/max/800/1*CCqyz-4RNC5xBd_DcYkLwA.png" alt="image" />
Partition Table</p>

<p><img src="https://cdn-images-1.medium.com/max/800/1*ehS5Y6FP7Tk3rj9MxKuU5g.png" alt="image" />
Ubuntu installer showing partitions</p>

<p>Step 5: Select partition #5 to install the Ubuntu OS. Define the mount point as “/” and format the partition using ext4 formatting. You can refer to the following link for more detailed Ubuntu install directions.</p>

<p><a href="https://ubuntu.com/tutorials/install-ubuntu-desktop-1804#7-begin-installation">https://ubuntu.com/tutorials/install-ubuntu-desktop-1804#7-begin-installation</a></p>

<p>Step 6: The installer will install the bootloader and configuration files into EFI A partition #1 and OS in partition #5. Once the installation is complete, the system will boot up with EFI A on partition #1 and the GRUB bootloader will load the OS installed in partition #5.</p>

<p>Step 7: After successful login into Ubuntu OS B, we need to move the EFI bootloader from EFI A partition #1 to EFI B partition #4. For this, perform the below given operations.</p>

<p>A). Mount EFI B partition temporarily: <strong><em>sudo mount /dev/nvme0n1p4 /mnt</em></strong></p>

<p>B). Copy EFI files from EFI A to EFI B: <strong><em>sudo cp -R /boot/efi/EFI /mnt/</em></strong></p>

<p>C). Unmount EFI B partition: <strong><em>sudo umount /mnt</em></strong></p>

<p>D). Get the UUID for EFI B partition <em>/dev/nvme0n1p4</em><strong><em>: sudo blkid -s UUID -o value /dev/nvme0n1p4</em></strong></p>

<p>E). Replace the UUID of <em>**/dev/nvme0n1p4 with /dev/nvme0n1p1 **</em>in /etc/fstab (/boot/efi) entry.</p>

<div class="language-plaintext highlighter-rouge"><div class="highlight"><pre class="highlight"><code>root@tester:~# sudo blkid -s UUID -o value /dev/nvme0n1p4
43F5-E57Y

root@tester:~# cat /etc/fstab
# /etc/fstab: static file system information.
#
# Use 'blkid' to print the universally unique identifier for a
# device; this may be used with UUID= as a more robust way to name devices
# that works even if disks are added and removed. See fstab(5).
#
#                
# / was on /dev/nvme0n1p2 during installation
UUID=6916e733-647a-4ce8-8b0c-61c4197000ef /               ext4    errors=remount-ro 0       1
# /boot/efi was on /dev/nvme0n1p1 during installation
UUID=45D1-4A56  /boot/efi       vfat    umask=0077      0       1
# swap was on /dev/nvme0n1p3 during installation
UUID=0811a10d-3312-48a7-a850-0c113d8bfdb8 none            swap    sw              0       0
</code></pre></div></div>

<p>Step 8: Now install Ubuntu A to the Ubuntu OS A partition. For that repeat steps 1 to 3. At the partitioning screen, select partition #2 for Ubuntu OS A. Define the mount point as “/” and format the partition using ext4 formatting. Please refer to the following link for more detailed Ubuntu install directions.</p>

<p><a href="https://ubuntu.com/tutorials/install-ubuntu-desktop-1804#7-begin-installation">https://ubuntu.com/tutorials/install-ubuntu-desktop-1804#7-begin-installation</a></p>

<p>After finishing step #8, you have UBUNTU OS A and UBUNTU OS B installed on partition #2 and partition #5 respectively. The EFI configuration installed on partition #1 will point to Ubuntu OS A. The EFI configuration installed on partition #4 will points to Ubuntu OS B. The next step is to use the EFI boot variables to switch between two Ubuntu instances. For this, we will use <strong>efibootmgr</strong> command. This allows us to alter the boot options from userspace.</p>

<p>efibootmgr -v will dump the current boot options. Ideally, we want to keep only OS A and OS B boot options and delete all the others, but depending on your requirement, you can alter the boot options.</p>

<div class="language-plaintext highlighter-rouge"><div class="highlight"><pre class="highlight"><code>root@tester:~# efibootmgr -v
BootCurrent: 0003
Timeout: 1 seconds
BootOrder: 0003,0000,0001,0002,0004,0005
Boot0000* Ubuntu-OS-A  HD(1,GPT,d92d26b7-1251-49f7-819e-742475c27581,0x800,0x30000)/File(\EFI\UBUNTU\SHIMX64.EFI)
Boot0001* Ubunut-OS-B  HD(4,GPT,9c85e16a-f97a-4b9b-bd25-64217d1b1884,0x6ff3000,0x30000)/File(\EFI\UBUNTU\SHIMX64.EFI)
Boot0002* UEFI:CD/DVD Drive     BBS(129,,0x0)
Boot0003* ubuntu        HD(1,GPT,d92d26b7-1251-49f7-819e-742475c27581,0x800,0x30000)/File(\EFI\UBUNTU\SHIMX64.EFI)
Boot0004* UEFI:Removable Device BBS(130,,0x0)
Boot0005* UEFI:Network Device   BBS(131,,0x0)
</code></pre></div></div>

<p>Delete all of the boot options below using the following command<em>.</em></p>

<div class="language-plaintext highlighter-rouge"><div class="highlight"><pre class="highlight"><code>sudo efibootmgr -b  -B
</code></pre></div></div>

<p>Example<em>: sudo efibootmgr -b 0000 -B</em> to delete the boot entry at 0000, and similarly for the rest of the boot entries by referencing the corresponding boot entry number.</p>

<p>Add two new boot entries for UBUNTU OS A and OS A</p>

<div class="language-plaintext highlighter-rouge"><div class="highlight"><pre class="highlight"><code>sudo efibootmgr -c -d /dev/nvme0n1 -p 1 -L "UBUNTUOSA" -l '\EFI\UBUNTU\SHIMX64.EFI'
sudo efibootmgr -c -d /dev/nvme0n1 -p 4 -L "UBUNTUOSB" -l '\EFI\UBUNTU\SHIMX64.EFI'
</code></pre></div></div>

<p>Switch the boot order from user space to boot from other OS after the next reboot.</p>

<div class="language-plaintext highlighter-rouge"><div class="highlight"><pre class="highlight"><code>sudo efibootmgr -o 0000,0001 -&gt; To boot from OS A
sudo efibootmgr -o 0001,0000 -&gt; To boot from OS B
</code></pre></div></div>]]></content><author><name>Manas Marawaha</name><email>manas.marwah@gmail.com</email></author><summary type="html"><![CDATA[Installing two versions of Ubuntu side by side in a dual boot configuration on a UEFI-based system.]]></summary></entry></feed>