The Importance of Performance Analysis
Performance analysis is a critical part of software development and system optimization. It helps developers understand where CPU time is spent, how efficiently cache memory is used, and how code changes influence performance. Without such insight, optimization becomes guesswork.
Linux provides a rich ecosystem of performance analysis tools. Among these, Cachegrind, Callgrind, and perf stat stand out as powerful utilities that enable developers to understand their program’s behaviour from both simulated and real-hardware perspectives.
Before diving into these tools, let’s briefly discuss CPU caching.
Modern CPUs use multi-level caches (L1, L2, L3) to bridge the speed gap between the processor and main memory. Efficient cache usage can dramatically improve performance, while cache misses lead to costly main-memory accesses.
Two core principles govern cache efficiency:
- Temporal Locality: If a program accesses a memory location, it is likely to access the same location again soon.
- Spatial Locality: If a program accesses a memory location, it is likely to access nearby locations soon.
Optimizing code to exploit these properties — for example, by accessing arrays sequentially, can make a dramatic difference. Profiling tools such as Cachegrind and perf stat allow us to observe and quantify these effects.
Matrix Multiplication Example
To demonstrate these tools, we will analyze three versions of a matrix multiplication program that multiplies two 512×512 floating-point matrices. The example set are part of Linux Debug Training course.
Example link: https://github.com/SpecialistLinuxTraining/linux-debug-training/tree/main/Examples/matrix_multiplication
- matrix_traditional — Implements the classic triple nested loop algorithm:
for (i = 0; i < SIZE; i++)
 for (j = 0; j < SIZE; j++)
 for (k = 0; k < SIZE; k++)
 C[i][j] += A[i][k] * B[k][j];
This version is simple but cache-inefficient, as it repeatedly accesses non-contiguous elements of matrix B.
-
matrix_avx2_basic — Uses AVX2 SIMD instructions to process eight floating-point values simultaneously. This reduces loop iterations and improves throughput by vectorizing operations.
-
matrix_avx2_optimized — Builds upon the AVX2 version with optimization techniques like blocking (tiling) and loop unrolling:
- Blocking enhances cache locality by dividing matrices into smaller blocks that fit into L1/L2 cache.
- Loop unrolling reduces loop overhead and increases instruction-level parallelism.
We’ll use these three programs to compare performance using Cachegrind and perf stat.
Results with Cachegrind: Simulated Cache Behavior
Cachegrind simulates how a program interacts with the CPU’s cache hierarchy. It reports metrics such as instruction counts, cache hits/misses, and memory access patterns — helping identify inefficient memory access.
$ valgrind --tool=cachegrind ./program
- The detailed profiling data is written to a file named cachegrind.out.{pid}
- cg_annotate is a command line tool which summarizes cache-related information per function and annotates source code with color-coded markers for cache events.
- kcachegrind can provide the cachegrind report in GUI form.
Running Cachegrind on our matrix multiplication programs gave:

Results from Cachegrind
Key observations:
- The traditional version suffered from poor spatial locality, as elements of matrix B were fetched from distant memory addresses repeatedly.
- The AVX2 basic version improved performance by vectorizing loads, enhancing both temporal and spatial locality.
- The AVX2 optimized version, with blocking, ensured that working sets fit within cache boundaries, minimizing evictions and L1 data misses.
Cachegrind provides reproducible, deterministic results since it simulates an idealized cache model rather than depending on hardware variability.
Results with perf stat: Real hardware events
While Cachegrind and Callgrind rely on simulation, perf stat measures real hardware events via CPU performance counters. It reports true execution behavior — including speculation, out-of-order execution, branch prediction, and actual cache misses.
We collected the following events:
perf stat -e instructions,cycles,cache-misses,\
L1-dcache-load-misses,L1-dcache-loads,\
L1-dcache-stores,LLC-load-misses,LLC-loads,\
branch-misses,fp_arith_inst_retired.256b_packed_single\
 ./matrix_variant
matrix_traditional:
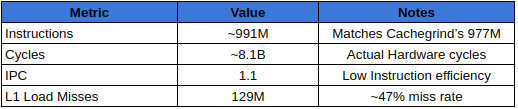
perf stats results for matrix_traditional
matrix_avx2_basics:
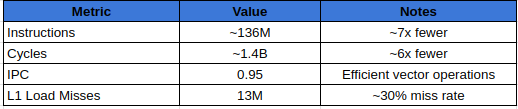
perf stat results with matrix_avx2_basics
matrix_avx2_optimized:
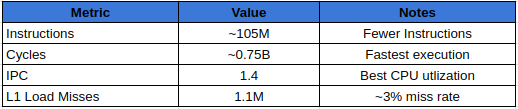
perf stats results for matrix_avx2_optimized
In summary:
- Cachegrind is ideal for micro-analysis of algorithms and memory access behavior.
- perf stat is indispensable for measuring true runtime performance and hardware utilization.
Conclusion
Performance analysis in Linux is a systematic process of measuring, comparing, and interpreting how programs execute at both the instruction and cache levels.
Tools like Callgrind and Cachegrind help you understand how efficiently your code executes in theory, while perf stat helps you measure how efficiently it runs in practice.
Through our matrix multiplication case study, we demonstrated how:
- AVX2 vectorization reduces instruction count by ~7×.
- Blocking and loop unrolling improve cache utilization, reducing L1 cache misses by ~10×.
- perf stat confirms real performance gains, showing higher IPC and lower CPU cycles.
In essence, combining Valgrind-based analysis with perf-based hardware profiling provides a complete picture of software performance — bridging the gap between code behavior and hardware efficiency.
LINUX DEBUG TRAINING
If you want to dive deeper, then you can also check out Part One and Part Two of the Linux Debugging Training Course. This course is a collaboration between my colleague John OSullivan and myself. We have combined our many years of experience in developing and debugging Linux systems to create a comprehensive technical guide that consolidates our knowledge.
This course offers a structured approach to Linux debugging, covering the entire stack — from user-space to kernel-space.
Join the course today! Access it via these links: Part 1, Part 2